
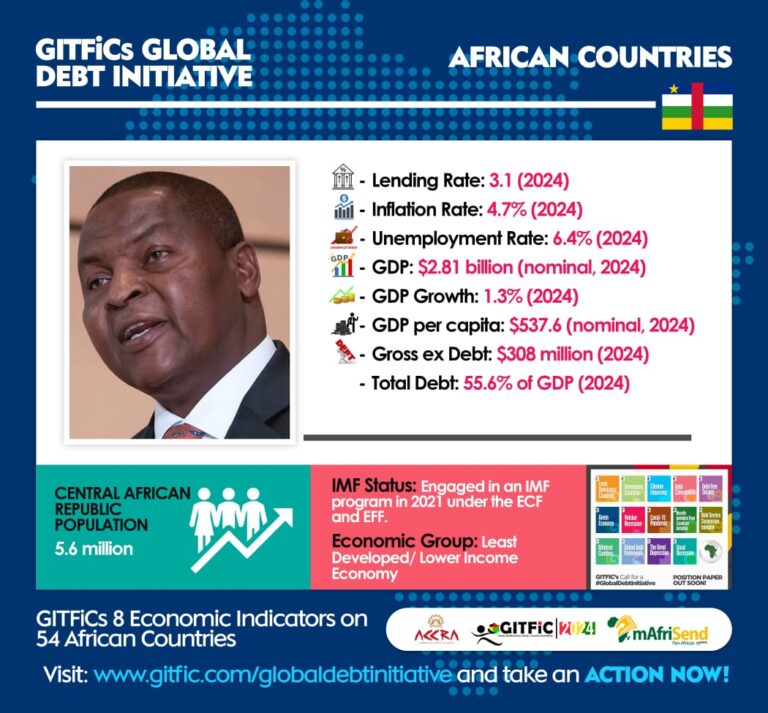
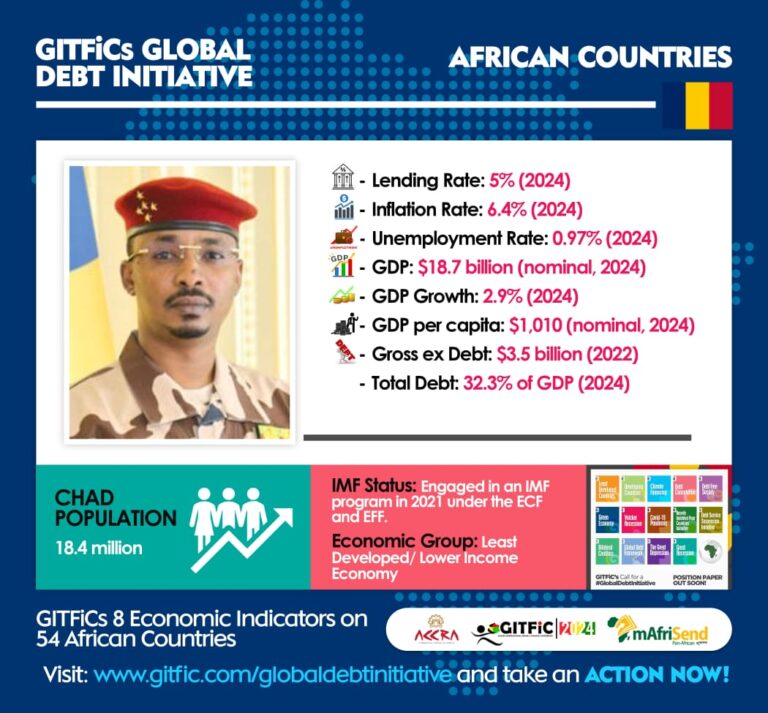
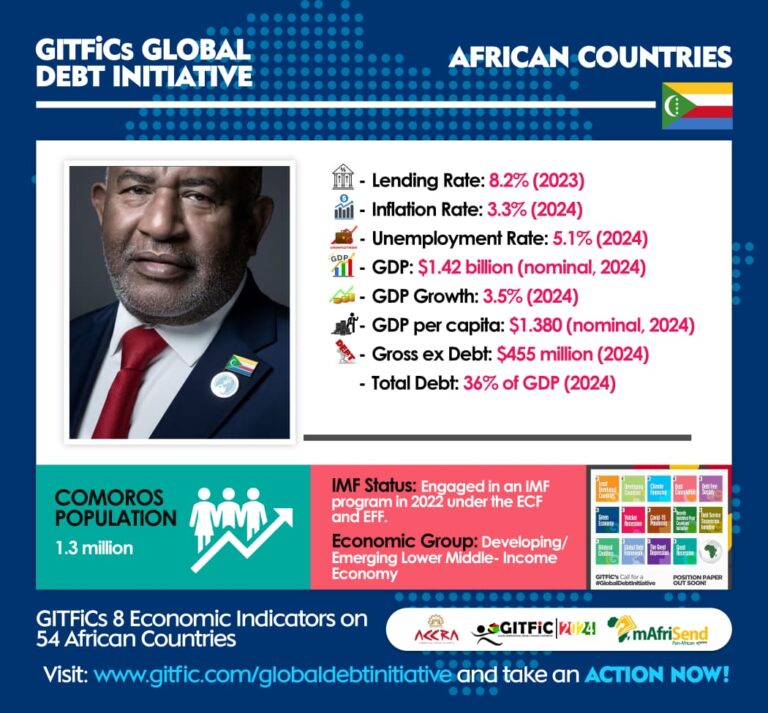
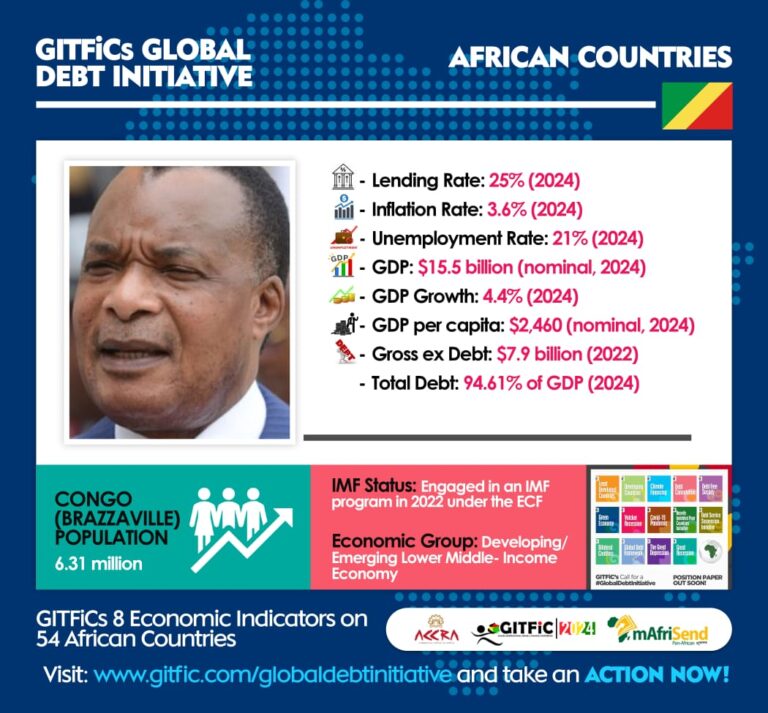
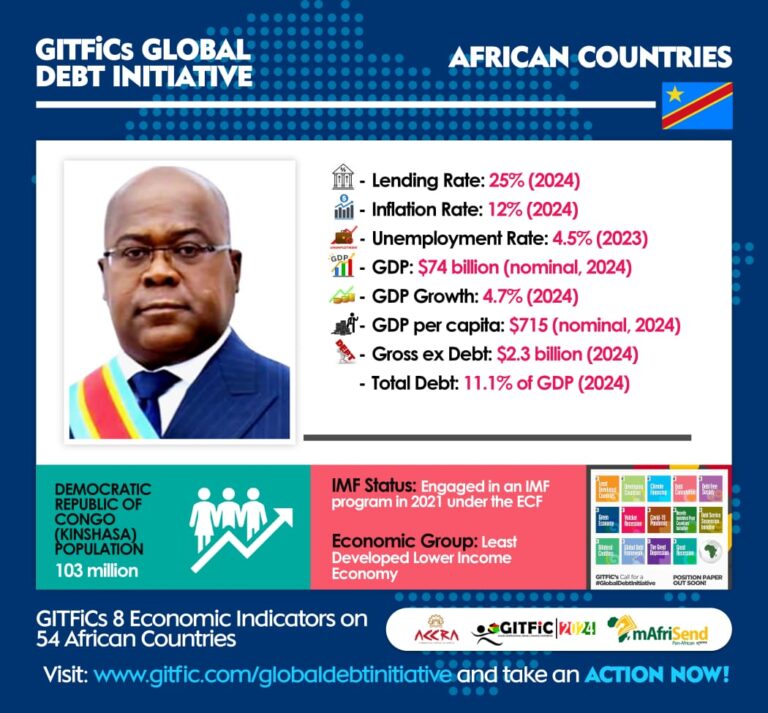
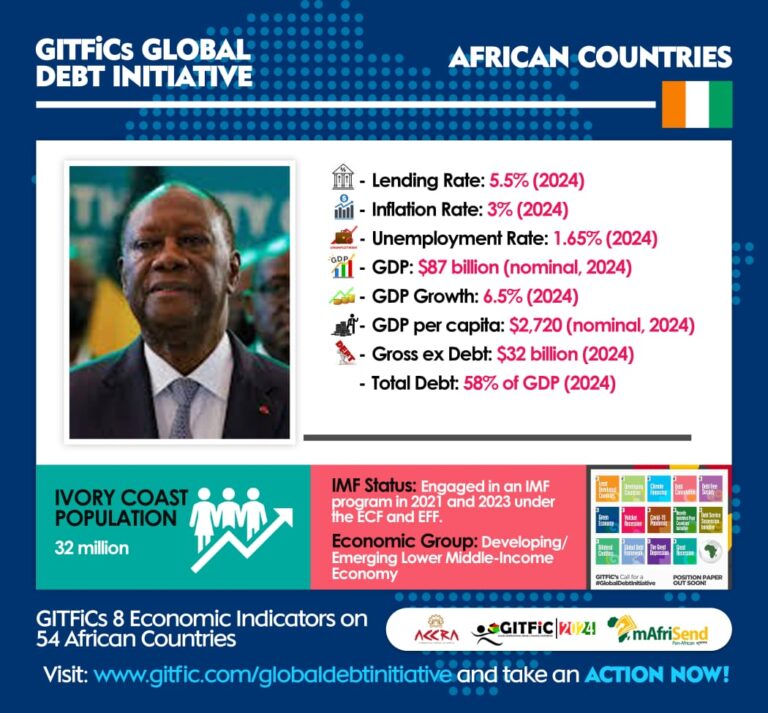
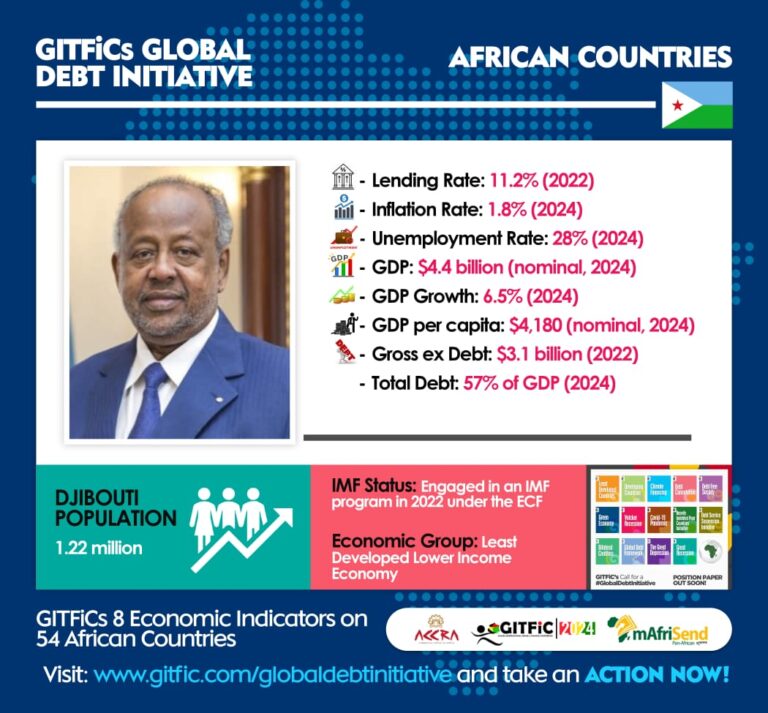
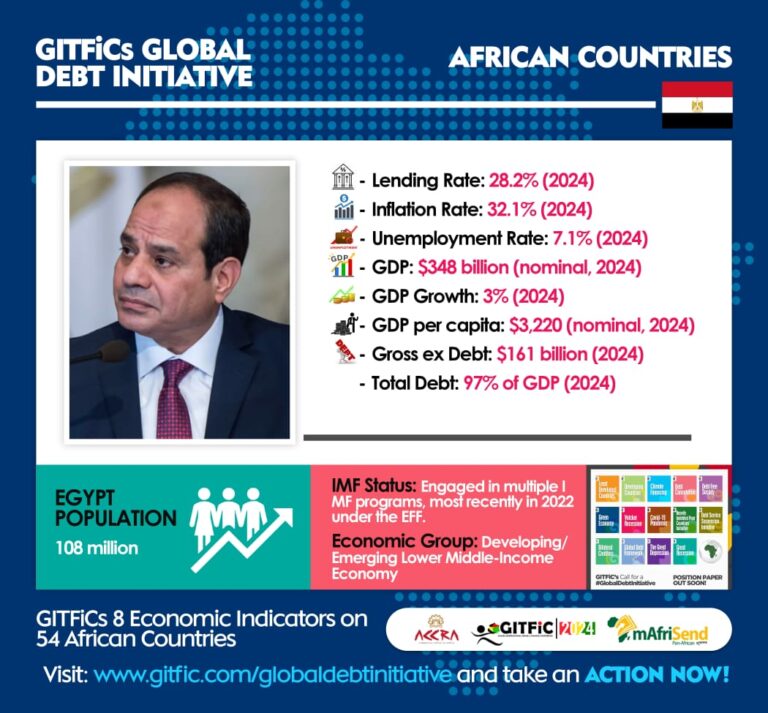
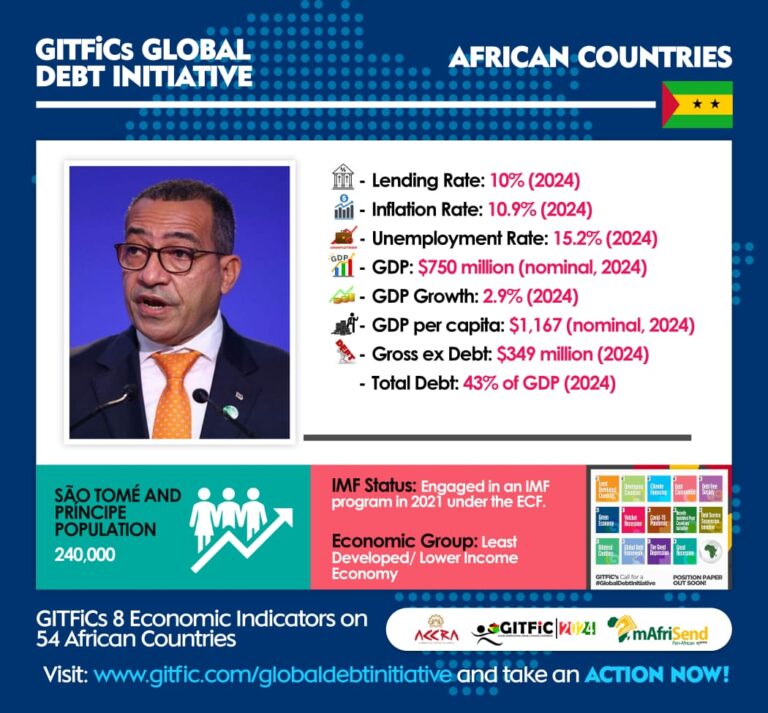
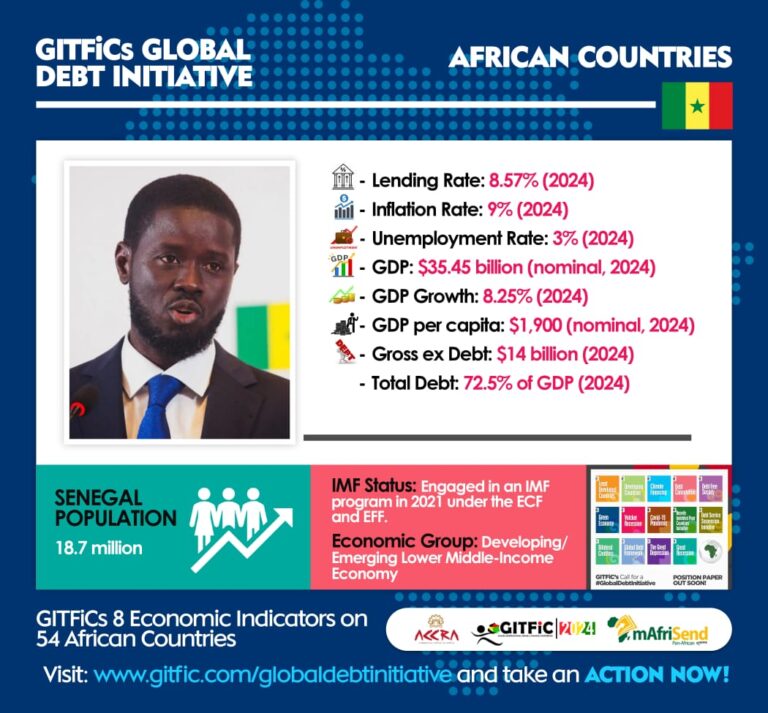
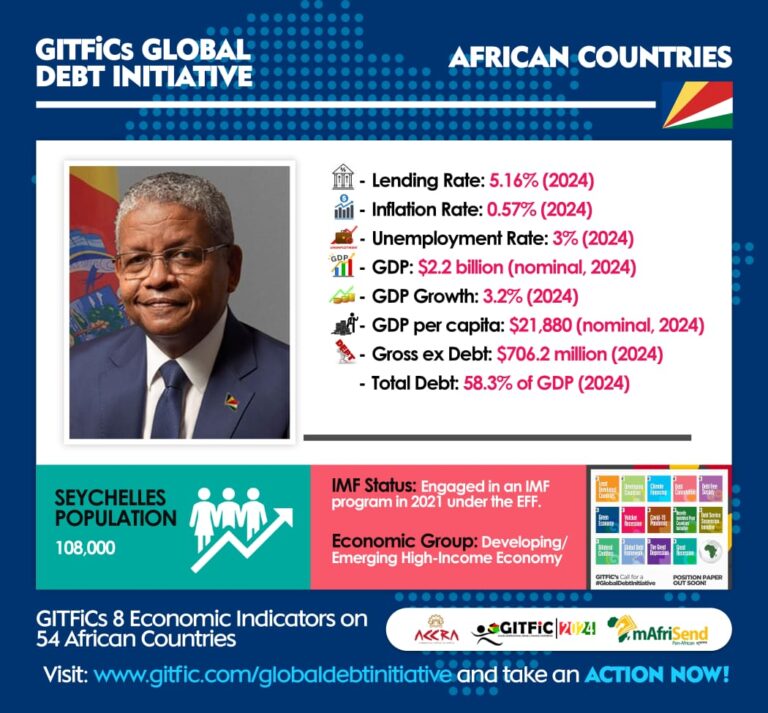
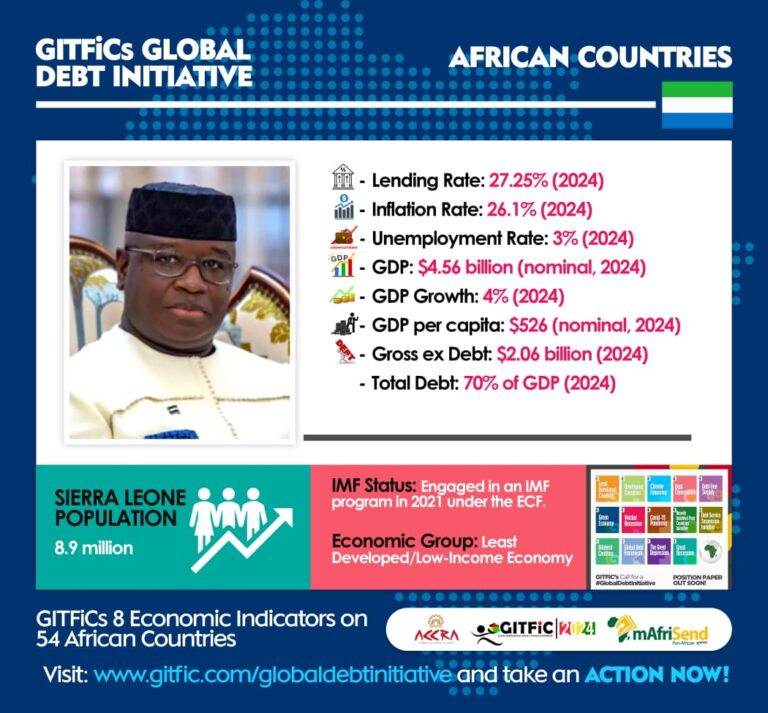
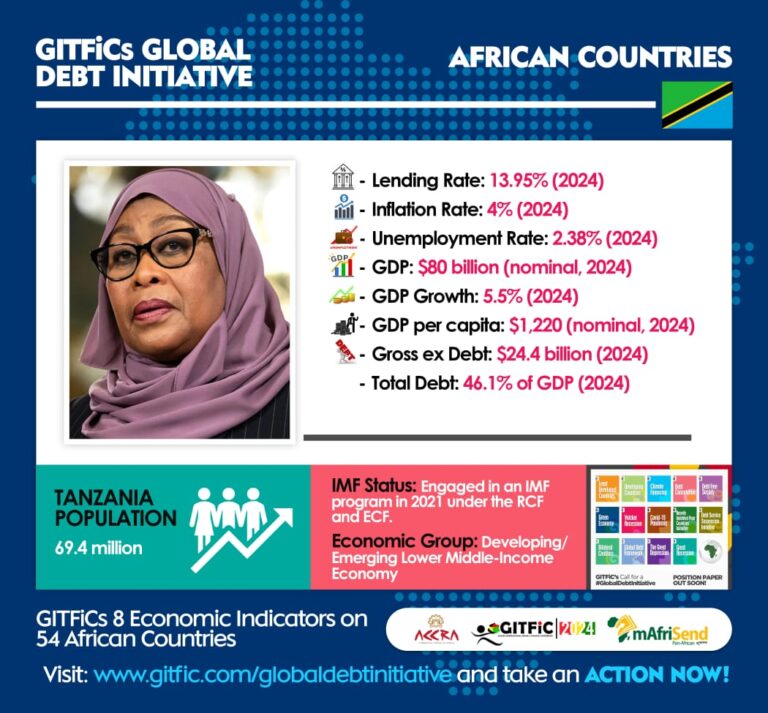
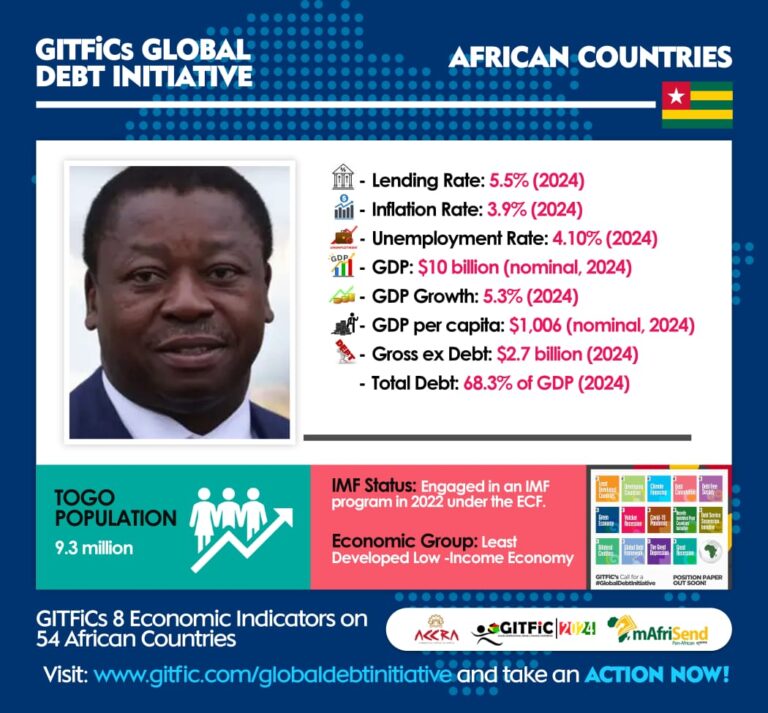
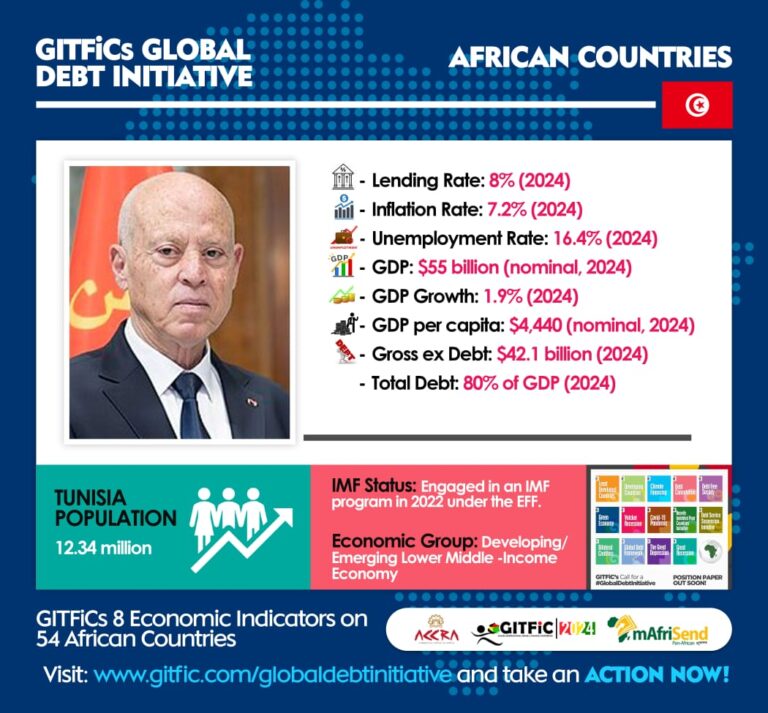
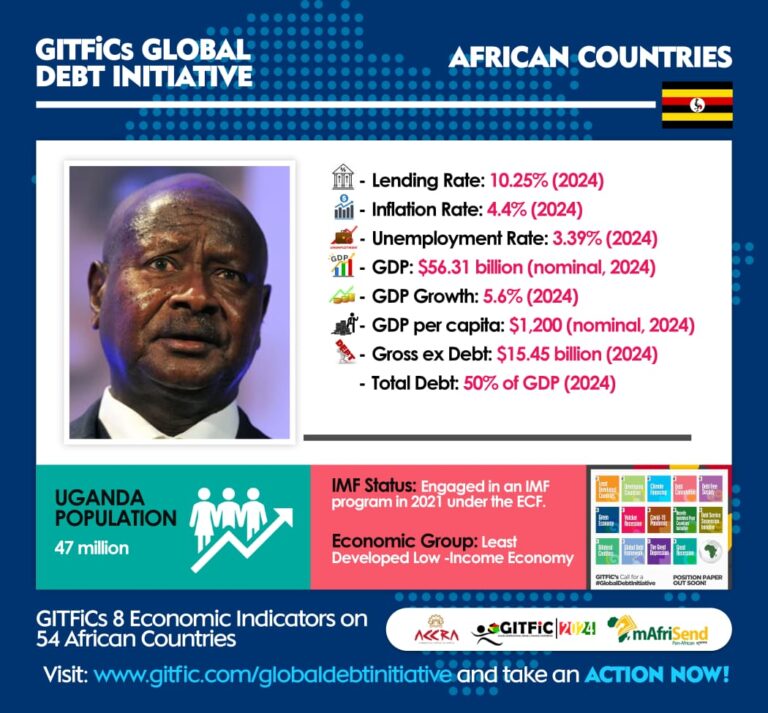
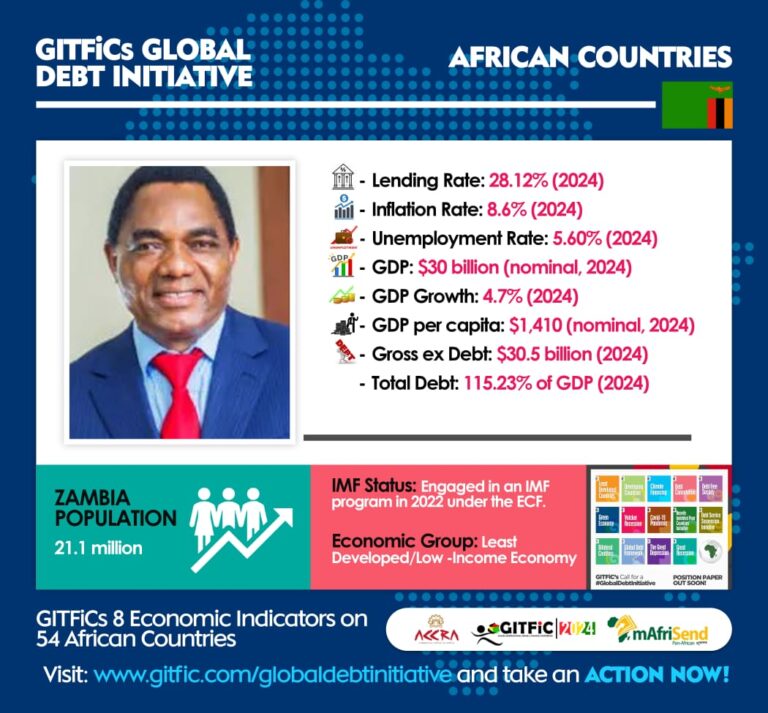
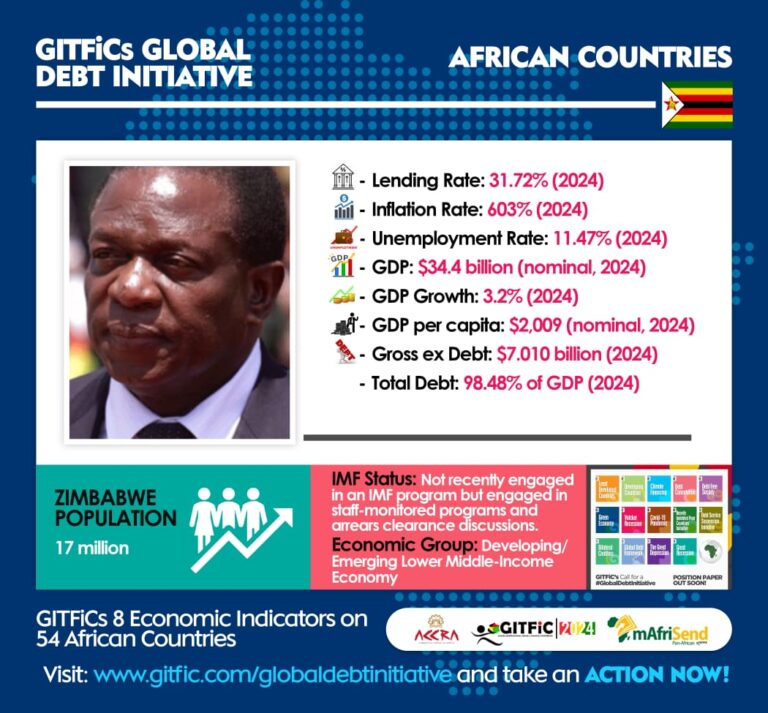
9 Economic Indicators


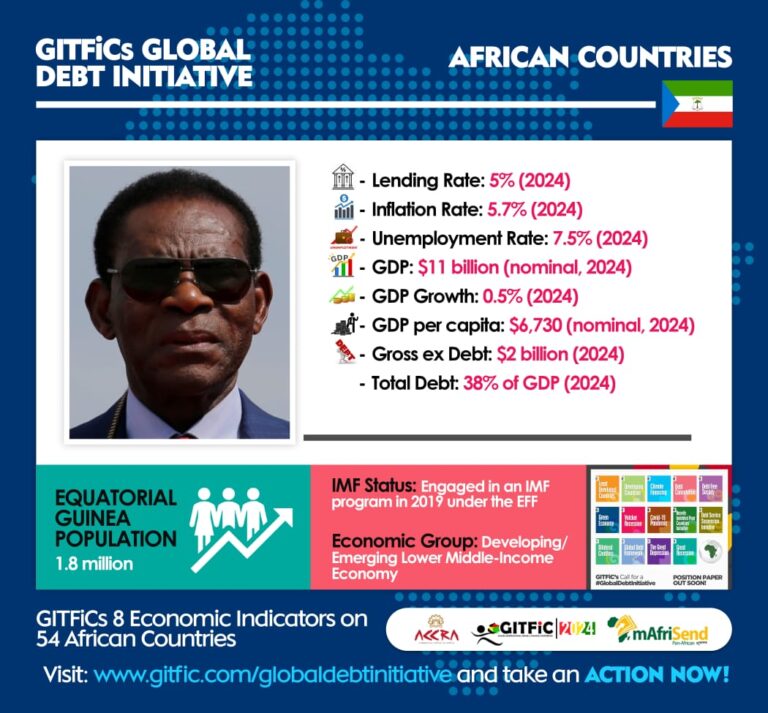
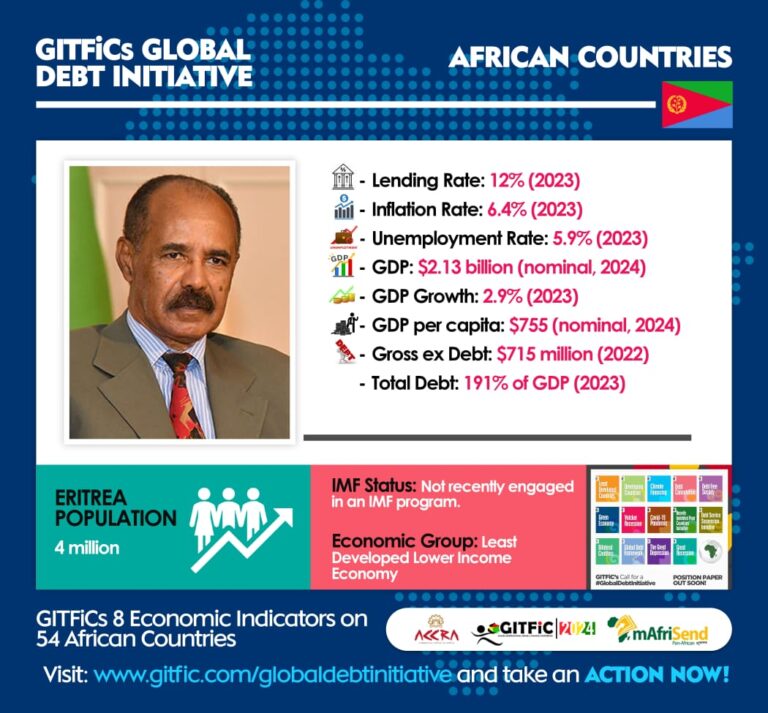
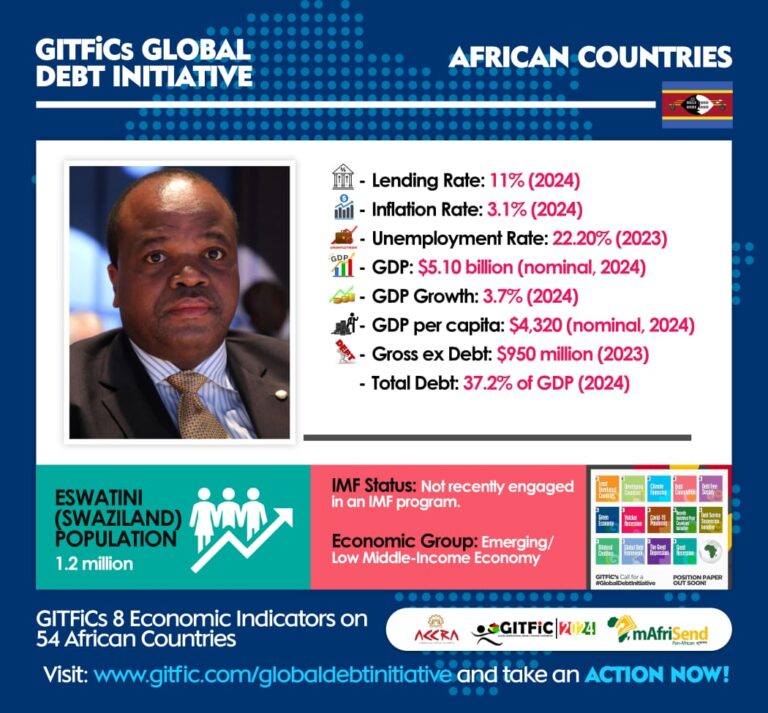
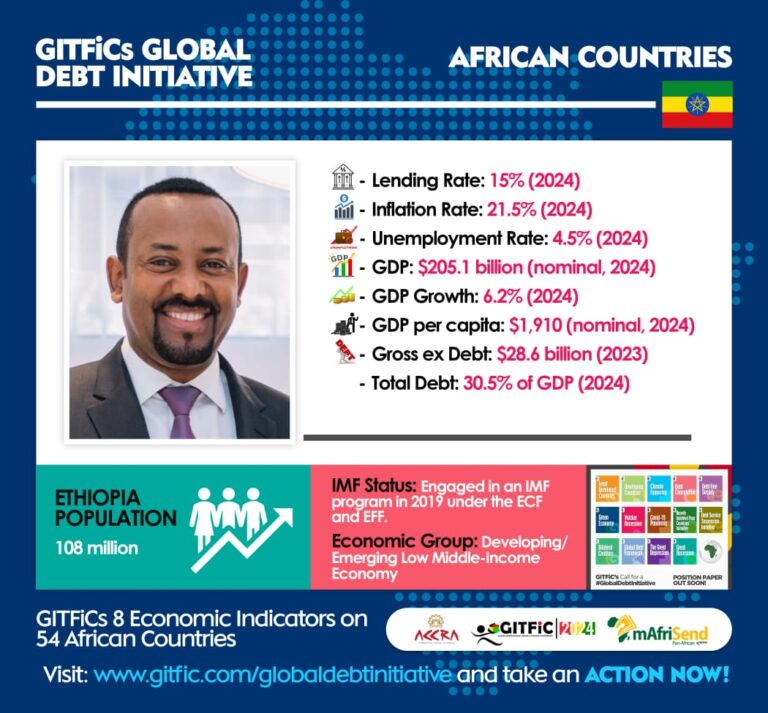
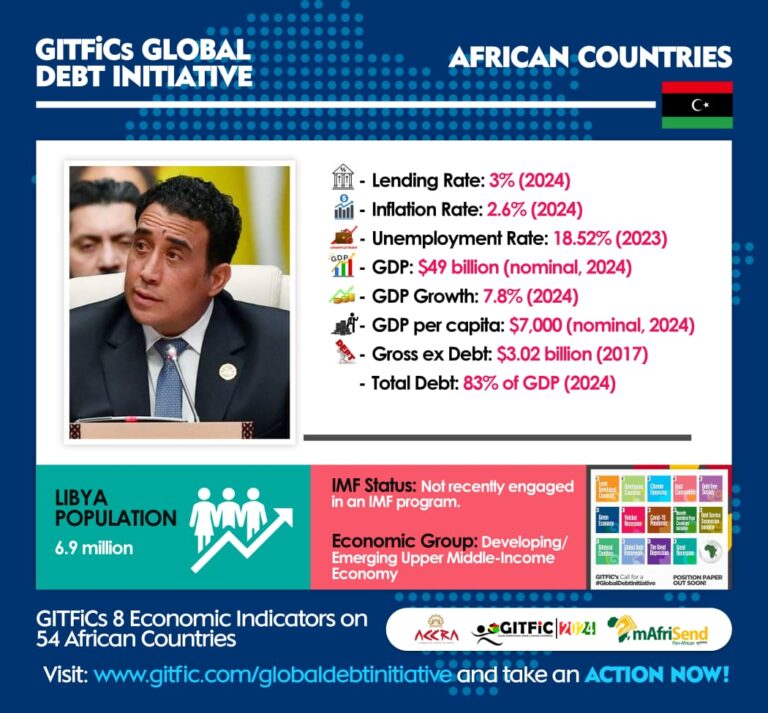
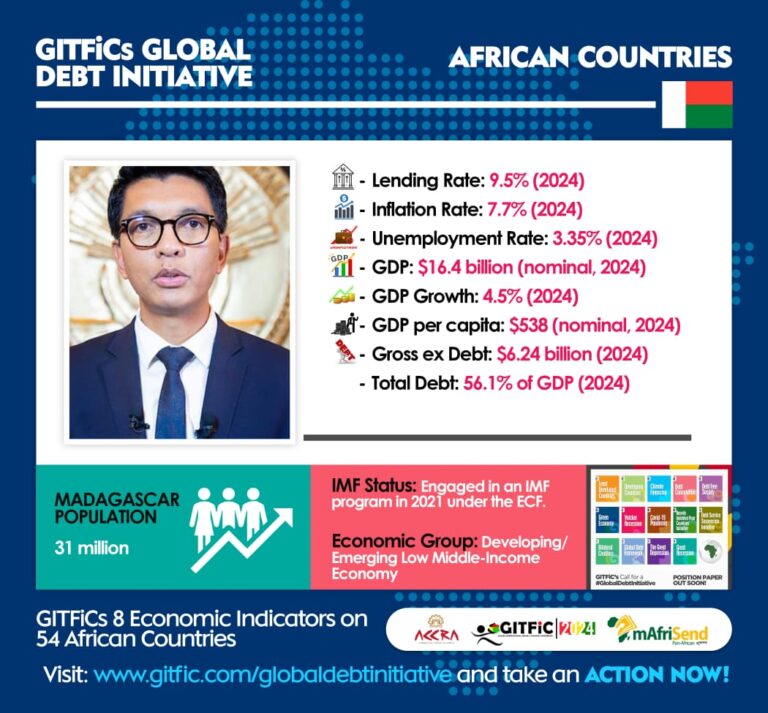
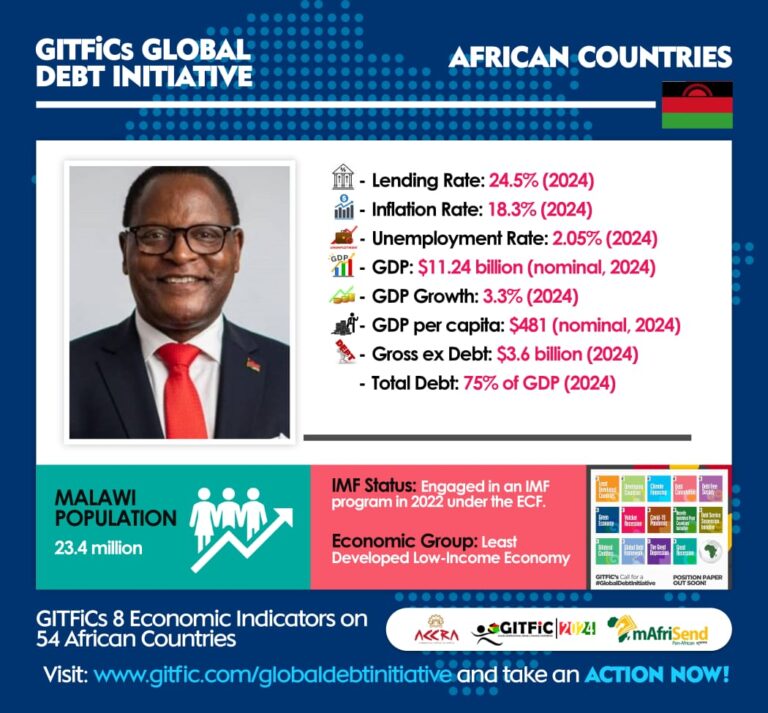
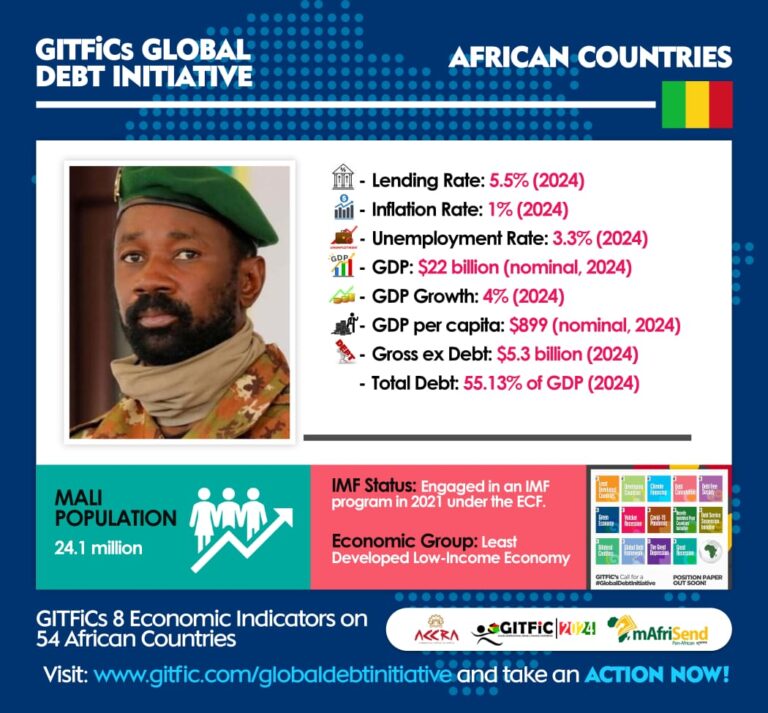
THE GHANA INTERNATIONAL TRADE AND FINANCE CONFERENCE PRESENT ITS MAIDEN 9ECONOMIC INDICATORS ON ALL 54 COUNTRIES ON THE AFRICAN CONTINENT
Economic Indicators:
– IMF Status
– Lending Rate
– Inflation Rate
– Unemployment Rate
– GDP
– GDP Growth
– GDP per capita
– Gross ex Debt
– Total Debt
– Population
This well researched indicators are made possible with insights from the World Bank, International Monetary Fund, AlFred Economic Data, Trade Economics Data, Statista, OECD, United Nations et al.
GITFiC have applied a common but comprehensive methodology to arrive at these indicators. We rate the success of the entire work as 92.7% accuracy. We sampled all 54 member states on the African Continent and applied the most current and accurate data to arrive at these economic statistics.
IMF Status:
By this, we intend to inform the African public, both domestic and external business communities and all stakeholders of the commitment of all member states’ and their respective programs with the International Monetary Fund also because, such policy credibility and structural adjustment programs intends to have direct bearing on an economy, both fiscal and monetary. GITFiCs focused impact here is to determine the health of Africa’s economies pre and post COVID19 in support of our call for A GLOBAL DEBT INITIATIVEas the medium to long term measure for fiscal space and economic growth.
Lending Rate:
Our first key indicator by a far extension determines the conducive business climate of an economy. The cost of borrowing is fundamental to the monetary health of an economy. A far reasonable lending rate also trickles down to the cost of doing business which to a large extent affects the prices of goods and services in an economy. A lending rate simply is an economic unit used by financial institutions mostly banks to meet the short to medium term financing needs of the private sector. It is the overall price a borrower pays after paying off a credit facility. Lending rate is mostly driven by inflation, bond yields and level of risk. Formula used for the purpose of this research; Interest = Principal x Rate x Tenure.This formula was subjective to accurate data from the statistical department of each member state and their development (bilateral and multilateral) partners.
Inflation Rate:
This is also an economic unit of measurement with the prices of goods and services of an economy. Practically, is the price of goods and services purchased by household hence, this is measured on month-on-month basis or year on year basis. This indicator also encompasses the health of an economy and determines the cost of living. Surprisingly, it will interest the general public to note that, inflation is predominantly caused by excessive jobs and higher wages. When this occurs, household incomes see a sharp increase,and this leads to a rise in consumer spending. Practically, aggregate demand sharply rises. Producers and Manufacturers will then increase the price of goods and services leading to higher inflation (CPI). The reverse is true. Inflation favors borrowers more than lenders. For the purposes of this research, GITFiC used an inflation calculator by smart assets and purchasing powers of all member states from credible available data. The value of the Ghanaian cedi, Nigerian Naira, Francophone CFA, Kenyan Shilling, Ethiopian Birr et al over a period were duly factored. Once again, for the purpose of this research-results, we used an inflationary projection for the end of 2024 which resulted in a slightly different rates for the month on month. We used the generic formula; (Price Index Year 2 – Price Index Year 1) ÷ Price Index Year 1 x 100 = Inflation rate in Year 1.
Practically for our research purposes, GITFiC considered the cost of a market variable two years ago against the same variable this year, divided the result by 2024(current year) and multiplied it by 100 to strike the percentage difference. We were aided by data from the aforementioned institutions.
Unemployment Rate:
The Percentage of labor force of a country who are jobless but actively looking for a job. Our data was heavily supported from the United Nations ILO. The growth of an economy is largely determined by its labor force. A higher unemployment rate of an economy simply means that economy is operating below its potential. To determine the labor force of an economy, GITFiC applied a simple calculation methodology as below; Total Labor employed + Total Labor unemployed = labor force. Labor forcedivided by working age population multiplied by 100% = participating rate.
GDP:
The monetary measurement or market value of all finished goods and services of an economy (country) over a specific period.This is a major and a key measurement of the health of an economy. Though it has limitations, GDP is a key tool to guide policymakers, investors, and businesses in strategic decision-making. GDP can be calculated in three ways, using expenditures, production, or incomes and it can be adjusted for inflation and population to provide deeper insights. GDP provides an economic snapshot of a country, used to estimate the size of an economy and its growth rate. For the purposes of our research and results needed to make the case for our indicators, we focused on the nominal basis, which is simply GDP without inflation, however GITFiC had used the real GDP results per each member state to arrive at the specific Growth Rate which was measured in percentage. GITFiC had used this simple equational methodology in arriving at the Real GDP (Nominal GDP/without inflation divided by GDP Deflator divided by 100%).Below is the formula we used for each member state per credible data available to us at the Ghana International Trade and Finance Conference – GITFiC;
GDP = Government spending + Investment + Consumption + Net Exports (total export – total imports)
For the purpose of our research, GITFiC used the expenditure approach for simplicity and much clarity. We could either have used the output or income approach however, all will arrive at the same result.
GDP Growth Rate:
The GDP growth rate compares the year-over-year (or quarterly) change in a country’s economic output to measure how fast an economy is growing. Usually expressed as a percentage unit, this unit of measure is popular for economic policymakers because GDP growth is thought to be closely connected to key policy targets such as inflation and unemployment rates.
If GDP growth rates accelerate, it may be a signal that the economy is over boiling, and the central bank may seek to raise interest rates. Conversely, central banks see a shrinking (or negative) GDP growth rate (thus; recession) as a signal that, rates should be lowered, and that stimulus may be necessary. Formula used here is as follows; Current year Real GDP less last year’s Real GDP divided by previous year’s Real GDP.
GDP Per Capita:
Simply put, the measurement of the total value of goods and services (GDP) per person by the population of that economy. It indicates that the amount of output or income per person in an economy can indicate average productivity or average living standards. GDP per capita can be stated in nominal, real (inflation-adjusted), or purchasing power parity (PPP) terms. At a basic interpretation, per-capita GDP shows how much economic production value can be attributed to each individual or citizen. For the purpose ofthis indicators, GITFiC used this formula; Real GDP divided by the Population = Per Capita. This was done according to the economic data available to GITFiC per member state.
Gross External Debt:
Governments lend on behalf of a country or economy. Such debts are beneficial for economic development. Such is known as prudent borrowing. Gross External Debt simply implies; actual and current outstanding amounts owed to non-domestic/foreign lenders (creditors outside your jurisdiction mostly commercial banks, governments, financial institutions – bilateral/multilateral) of a country. This is without liabilities or contingencies and paid with interest or the principal in the future. These were derived from data available to GITFiC from the national source of member state with comparison of data from creditors/lenders. Formula: With the help of methodology from AlFred economic analysis, we strike the total National Debt percentage to GDP of each member state by the most recent value of the GDP = Total External Debt.
Total Debt to GDP:
The economic metric that compares a country’s Public Debt to its Gross Domestic Product. In this case, our methodology expected GDPs to be used for repayments. This made our ratio accurate and precise. A default rate is dependent on the higher the Debt to GDP. It is obvious that defaults triggers panic which leads to several implication of a country most especially, preventing such country from going to the domestic and international market. The formula we used, which is defined in our first sentence is Total Debt of Country divided by Total Gross Domestic Product of that same Country. Refinancing your debt hampers economic growth. A higher debt to GDP of a country simply means, that country will find it difficult to refinance his/her debt obligations. Reason most countries in Africa per these indicators are finding it difficult to have their economies stable.
Population:
The entire research on our results for all 54 member states was heavily dependent on accurate data on population. The entire metrics and unit of measurements were because of the undiluted data we had on the exact and projected population growth of all countries under review. The entire number of people in a particular country or region is define as population. Our research had depended on figures from the World Bank, United Nations and National population census data of recent times through their various statistical service information portals. GITFiC’s research picked raw data into our methodology for the results we have on all 8 indicators.
Keynotes:
● Africa’s total accumulative Indebtedness – $1.215 trillion
● Africa’s total accumulative External Debt – $722 billion
* Africa’s common list of Creditors –
1. Multilateral institutions:
– International Monetary Fund (IMF)
– World Bank (IBRD and IDA)
– African Development Bank (AfDB)
– European Investment Bank (EIB)
2. Bilateral creditors:
– China (through various state-owned banks and institutions)
– France (Agence Française de Développement, AFD)
– Germany (KfW Development Bank)
– Japan (Japan International Cooperation Agency, JICA)
– United Kingdom (UK Export Finance)
– United States (US Agency for International Development, USAID)
3. Commercial creditors:
– Private banks (e.g., Citigroup, Standard Chartered, HSBC)
– Bondholders (investors in African Eurobonds)
4. Other creditors:
– Paris Club (a group of creditor countries)
– Non-Paris Club creditors (e.g., India, Brazil)
– Arab financial institutions (e.g., Arab Fund for Economic and Social Development)
● Africa’s average inflation – 12.2%
● Africa’s total population – 1.34 billion people
● Africa’s total unemployment rate – 7.7 Percent
● Africa’s average lending rate – 19.5%
● Africa’s average growth rate – 3.8%